- Most economic evaluations involve estimating project parameters (prices, interest rates, timing, etc)
- Sensitivity analysis gives a better understanding on how uncertainty affects the outcome of the evaluation
- Here examine sensitivity of performance measures to changes in the values of uncertain parameters
Some Sensitivity Analysis Methods Include
Sensitivity Graphs
- Illustrate sensitivity of performance measures (like PW, AW) to changes in parameters Decision Trees
- Use probabilistic information to vary input variables to understand how much a final decision or outcome changes identifying which inputs are the most critical Break-even Analysis
- Answers the question “what production level is necessary for PW ≥ 0”
- We basically solve the above equation Principles of Probability
- Helps to understand risk
Sensitivity Graph Analysis
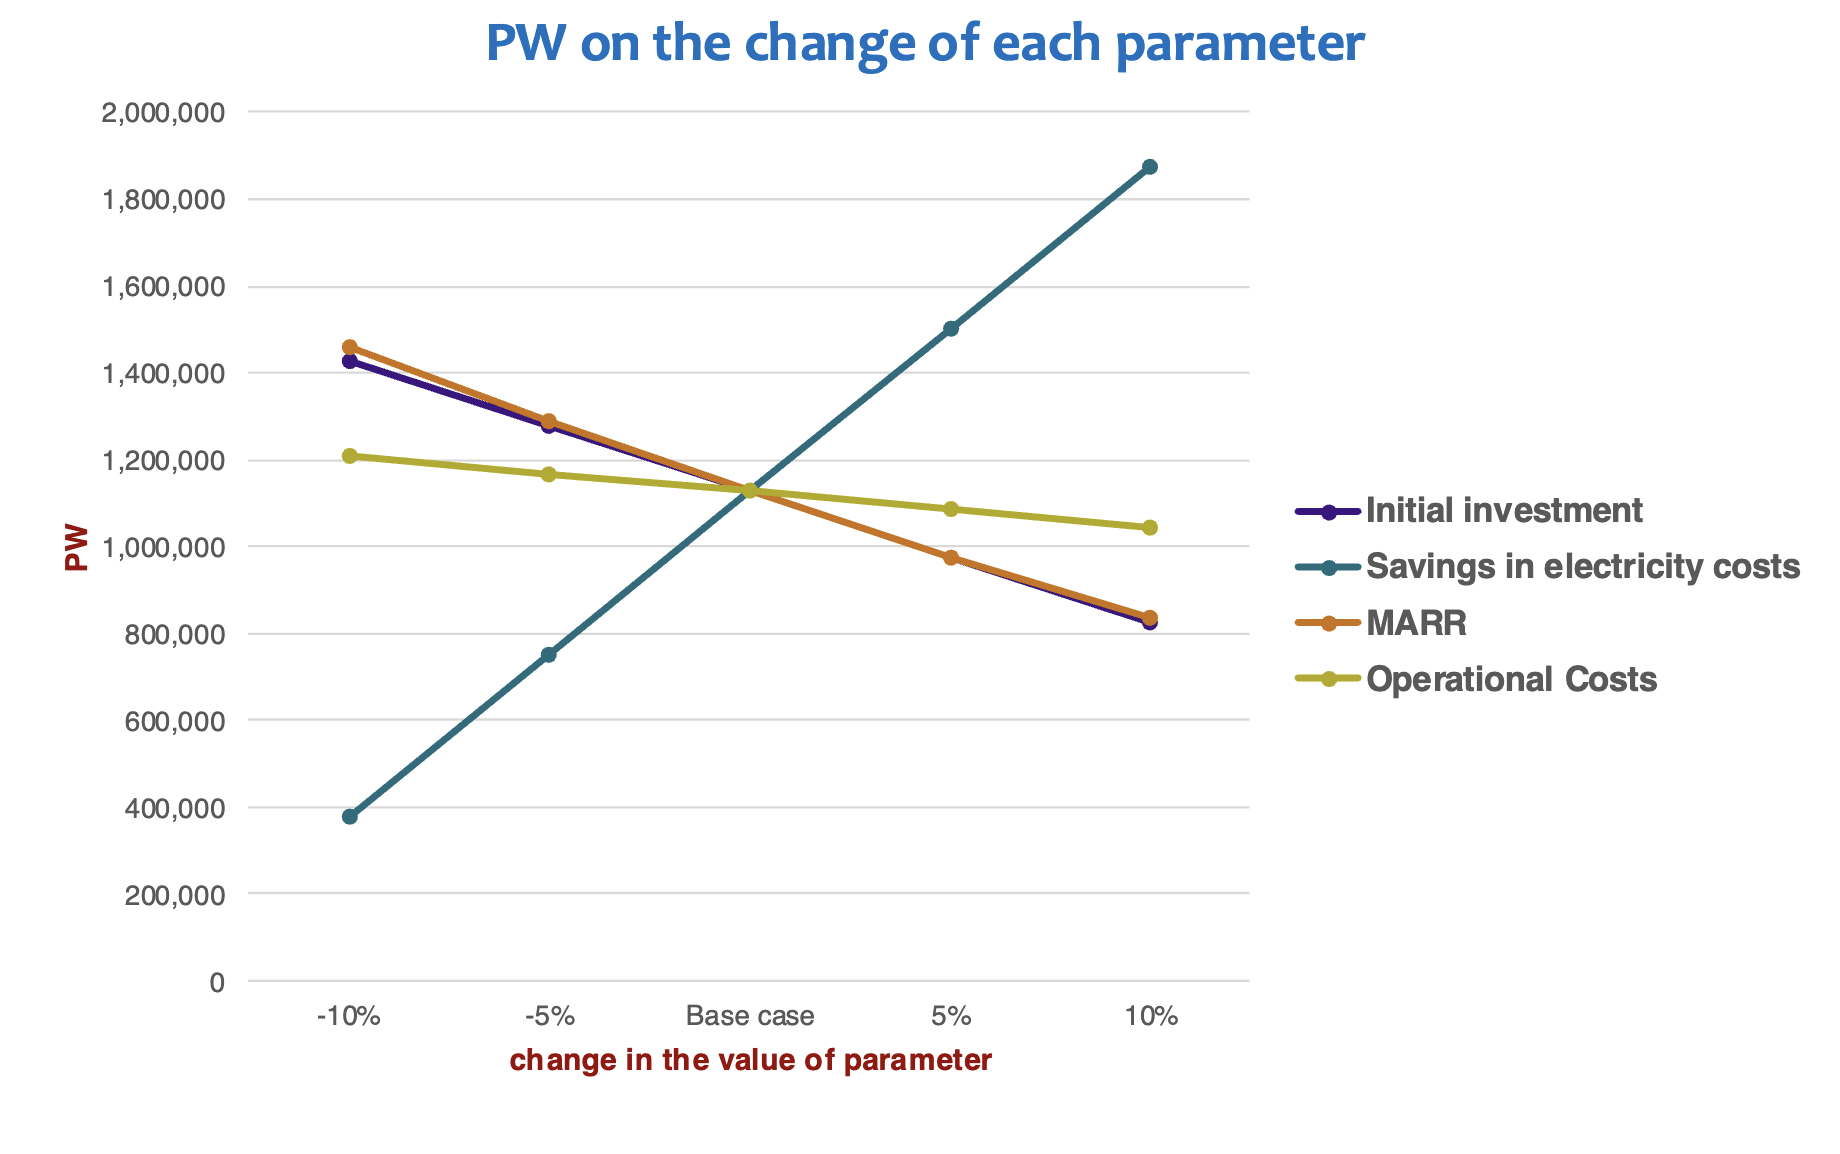
- Obtain the PW of the project based on estimated values for parameters (capital cost, O&M costs, salvage price, savings/benefits/incomes, and interest rate) as the base case
- Then, at each run, assume one parameter changes while keeping others constant at their base level
- Typical range for change in values: -10%, -5%, +5%, +10%
- Graph the PW on the change of each parameter
- We need to do this in excel since there are many cases that we need to consider
- Then we graph PW vs the parameter change which generates a graph like this…

Decision Trees
- Formal methods aid engineers in evaluating complex problems under uncertainty / risk:
- Provides means of decomposing a large problem and structuring it into sequence of smaller components
- Suggests a variety of decision criteria to help with the process of selecting a preferred course of action
- Provides a graphical means of structuring where uncertainties are characterized by probability distributions
- Clarifies options decision maker has / provides framework with which to deal with the risk involved
There are four main components in a decision tree:
- Decision node: Represents a decision to be made by the decision maker – denoted by a square
- Chance node: Represents an event whose outcome is uncertain – denoted by a circle
- Branches: Connect nodes from left to right, depicting the sequence of possible decisions and chance events
- Leaves: Indicate the values, or payoffs, associated with each terminal (rightmost) branch of the tree A decision tree grows from left to right, illustrating the flow of decision-making and uncertainty
To Analyze the Tree:
- Start from the leaves and move backwards to the left
- At any chance node, calculate the EV and put the value on the chance node
- At any decision mode, make a decision based on values and criterion for decision making and terminate the unchosen decisions by “//” and put the value of decision on the decision node
- Continue until the root node is reached
Note
- Whenever a chance node follows a decision node, it implies that the decision maker must anticipate the outcome of future uncertain events in decision making.
- When a decision node follows a chance node, it implies that a decision must be made assuming that a particular outcome of a chance event has occurred.