Bode Plot
This is the main graphical representation of a frequency response. It has magnitudes and phases. For a given frequency, shows that your frequency response is in a graphical way. The Bode plot contains a magnitude and phase. The x-axis is typically in a logarithmic scale, and the y-axis is in a decibel scale
You basically just, solve for the frequency response of a given system (transfer function where ) and plug in different values of and see what the frequency response is
General Rules
General rules for approximate graphing
- Your magnitude break points are or the s roots in the numerator and denominator
- Your phase angle break points are 10x and 0.1x of each magnitude break point
- Given a transfer function
- Identify poles and zeroes
- Transform into Bode forms (normalized forms)
- These forms look like this:
- You may need to complete the square?
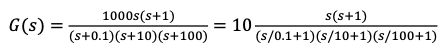
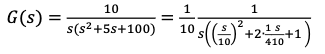
- These forms look like this:
- List the breakpoints in ascending order
- For magnitude plots:
- For phase plots: where you list them basically in the same order by also by the front magnitude
- Continue plotting for subsequent breakpoints
- At each breakpoint, change the slope accordingly (for magnitudes)
- Ex. for a 1st order breakpoint, change the slope by 20, for a 2nd order, change the slope by 40
- The change is positive for zeros and negative for poles
- The last line needs a slope of -20
- At each point (0.1x and 10x), change the slope accordingly (for phases)
- For each 0.1x point, If it is for the 1st order term, change the slope by 45°, for a 2nd order, change the slope by 90°
- The change is positive for zeros and negative for poles
- For each 10x point, do it in negative way
- The final line must lie flat with a slope of -90°
- At each breakpoint, change the slope accordingly (for magnitudes)
- If there is an in the TF, it changes the first line segment of the Bode plot
- Here, we draw the first line of the magnitude plot with a slope of 20p and its value at
- Draw the first line of the phase plot with a flat line with °
- If any break point coincides with the other one, apply the rules multiple times according to each rules
Minimum Phase System
- This is a system whose poles are all in the LHP
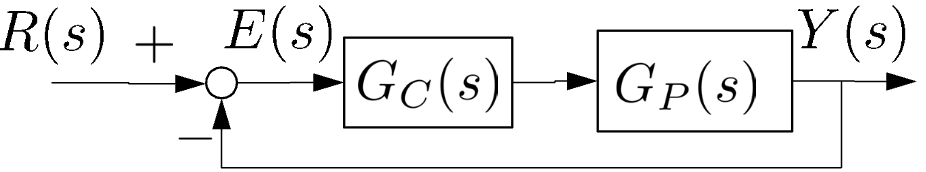
Sensitivity Function
- The ratio of the fractional change in (closed-loop TF) to the fractional change in (the plane TF)
 Sensitivity function for the TF above is…
The complementary transfer function i defined as
Gain Phase Relationship
- When the slope of versus on a log-log scale persists as a constant value for a decade of frequency, then is related to as where n is the slope of the magnitude in [decade/decade]
- This can be used as a guide to infer stability from
Infinite Gain at = 0 for Tracking
- We want large amplitudes (gains) are low frequencies which means we need at least 1 s (we want a System Type of I or II)
- Open Loop FR:
- Closed Loop PR:
- We want to be 0 for low frequencies…
- Consider ( |G(j\omega)| ) with its behaviour where is the cross-over frequency
- Then, the closed-loop transfer function (TF) becomes
- Where at
- For our closed-loop
- Range of frequencies that have good closed-loop tracking performance, or maximum freq. that can be tracked
- A typical indicator of speed of response
- The closed-loop bandwidth is closely related to crossover frequency of the open-loop frequency response as
Loop Shaping
We use our understanding of Bode Plots for Loop Shaping